Cash savings are a great way to provide financial security. Savings can help with both your short and long-term financial goals, planned spending and building an emergency fund for any unexpected expenses.
Consider saving if you:

Investing is a great way of making your money work harder for the future once you've got your rainy day savings sorted, especially during periods of high inflation. Generally speaking, money invested over the longer-term can potentially provide higher returns than savings accounts, depending on interest rates and levels of risk.
Consider investing if you:
The value of investments and the income from them can fall as well as rise, and you may get back less than you invest. If you're not sure about investing, seek financial advice. There will normally be a charge for that advice.
This graph shows a comparison of savings and investments over 10 years.
Past performance is not a reliable indicator of future performance and remember that the value of investments can fall as well as rise, and you may get back less than you invest.
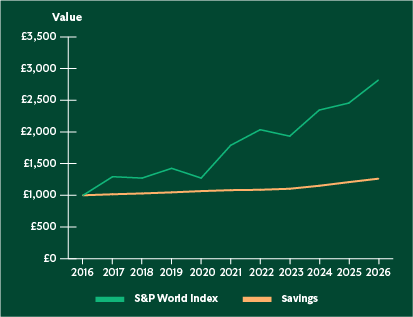
Source: S&P Dow Jones Indices, S&P World Index (GBP).
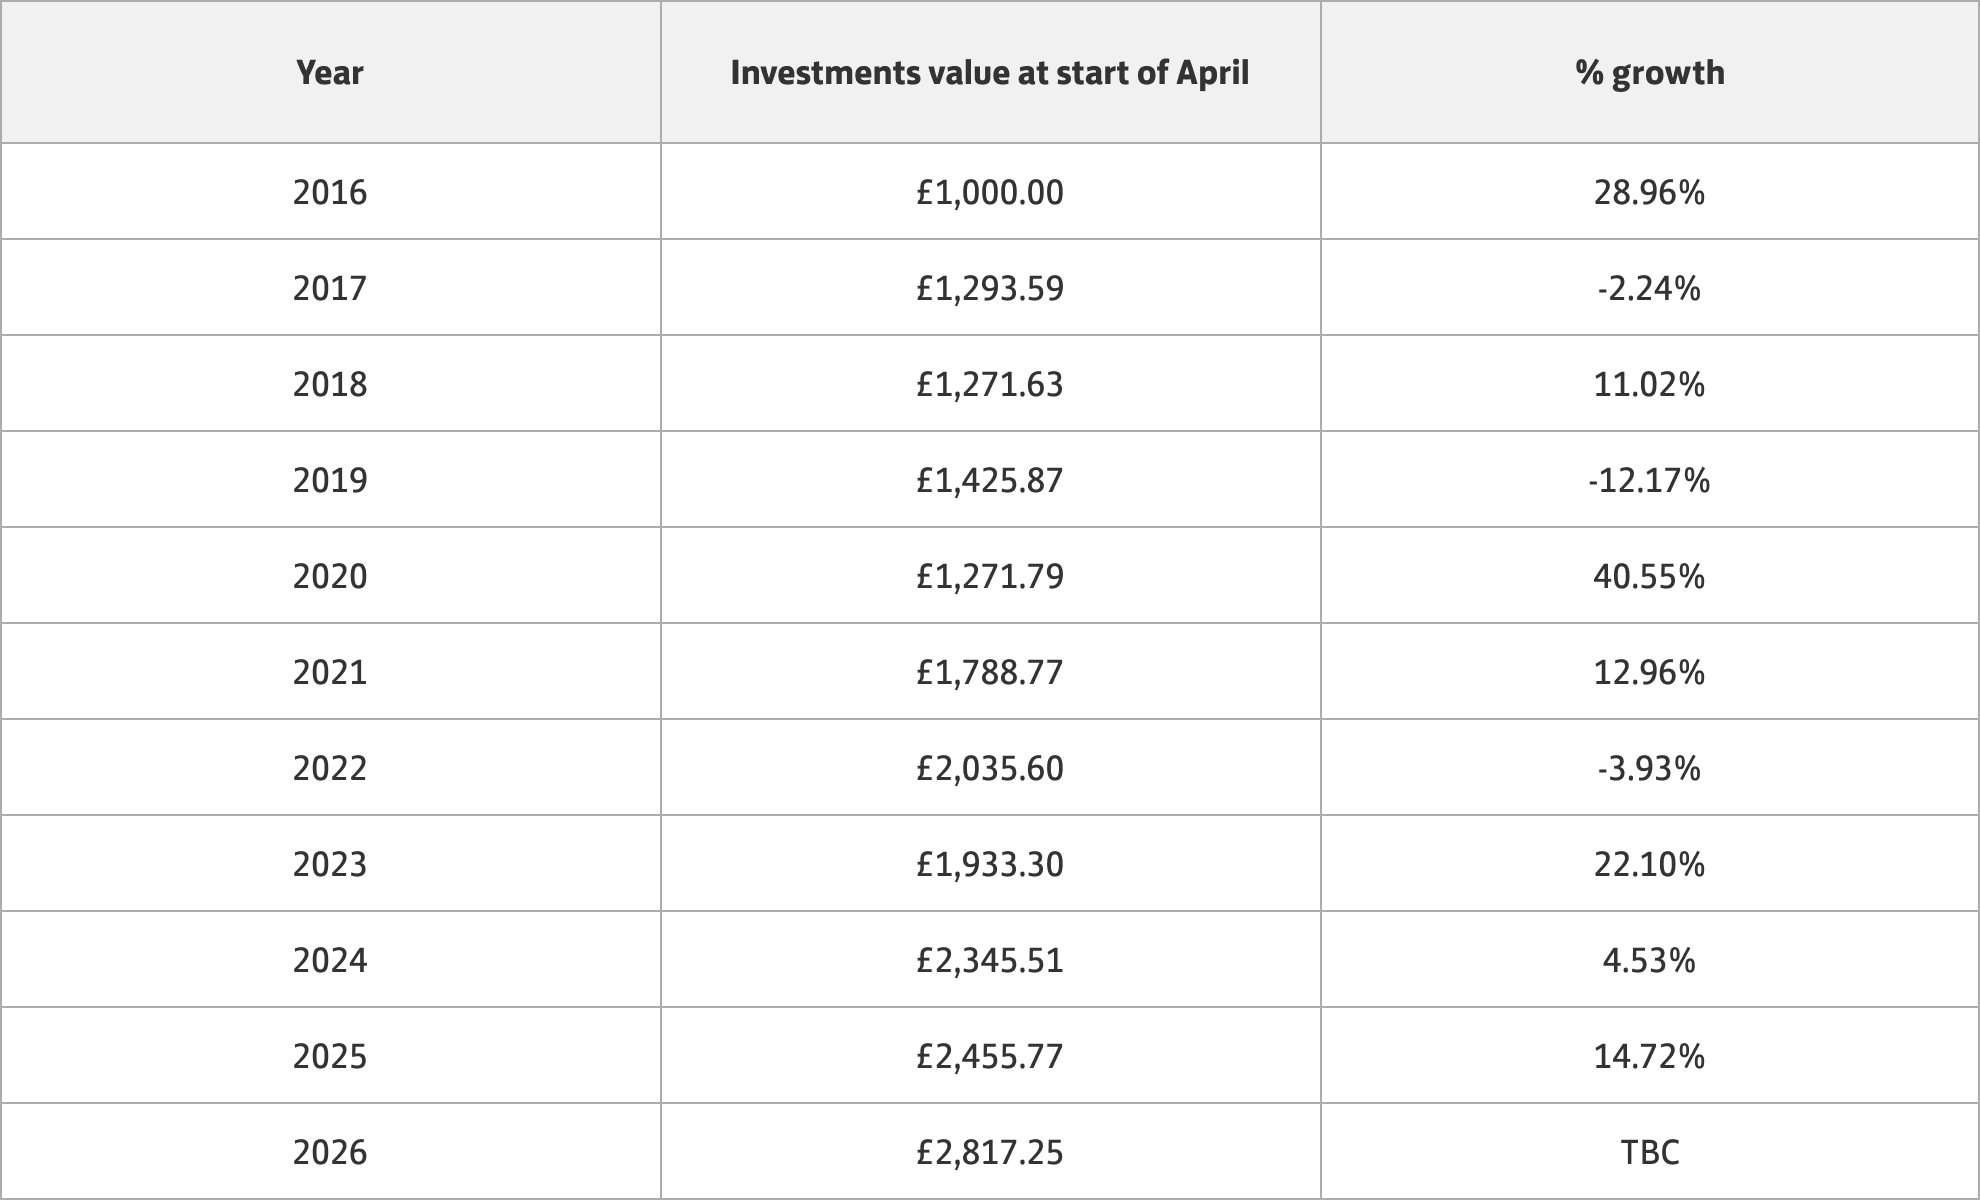
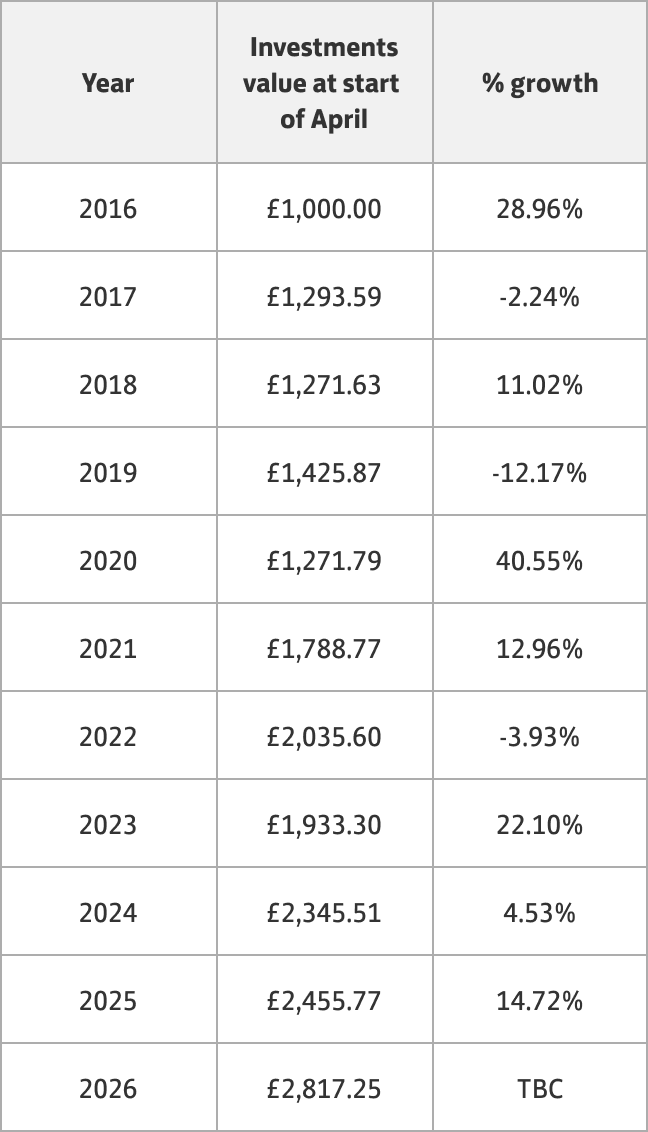
Total investments value as of 01/04/2026 is £2,817.25.
Source: MoneyFacts 12m Fixed Non ISA rates (decile 2), April 2026.
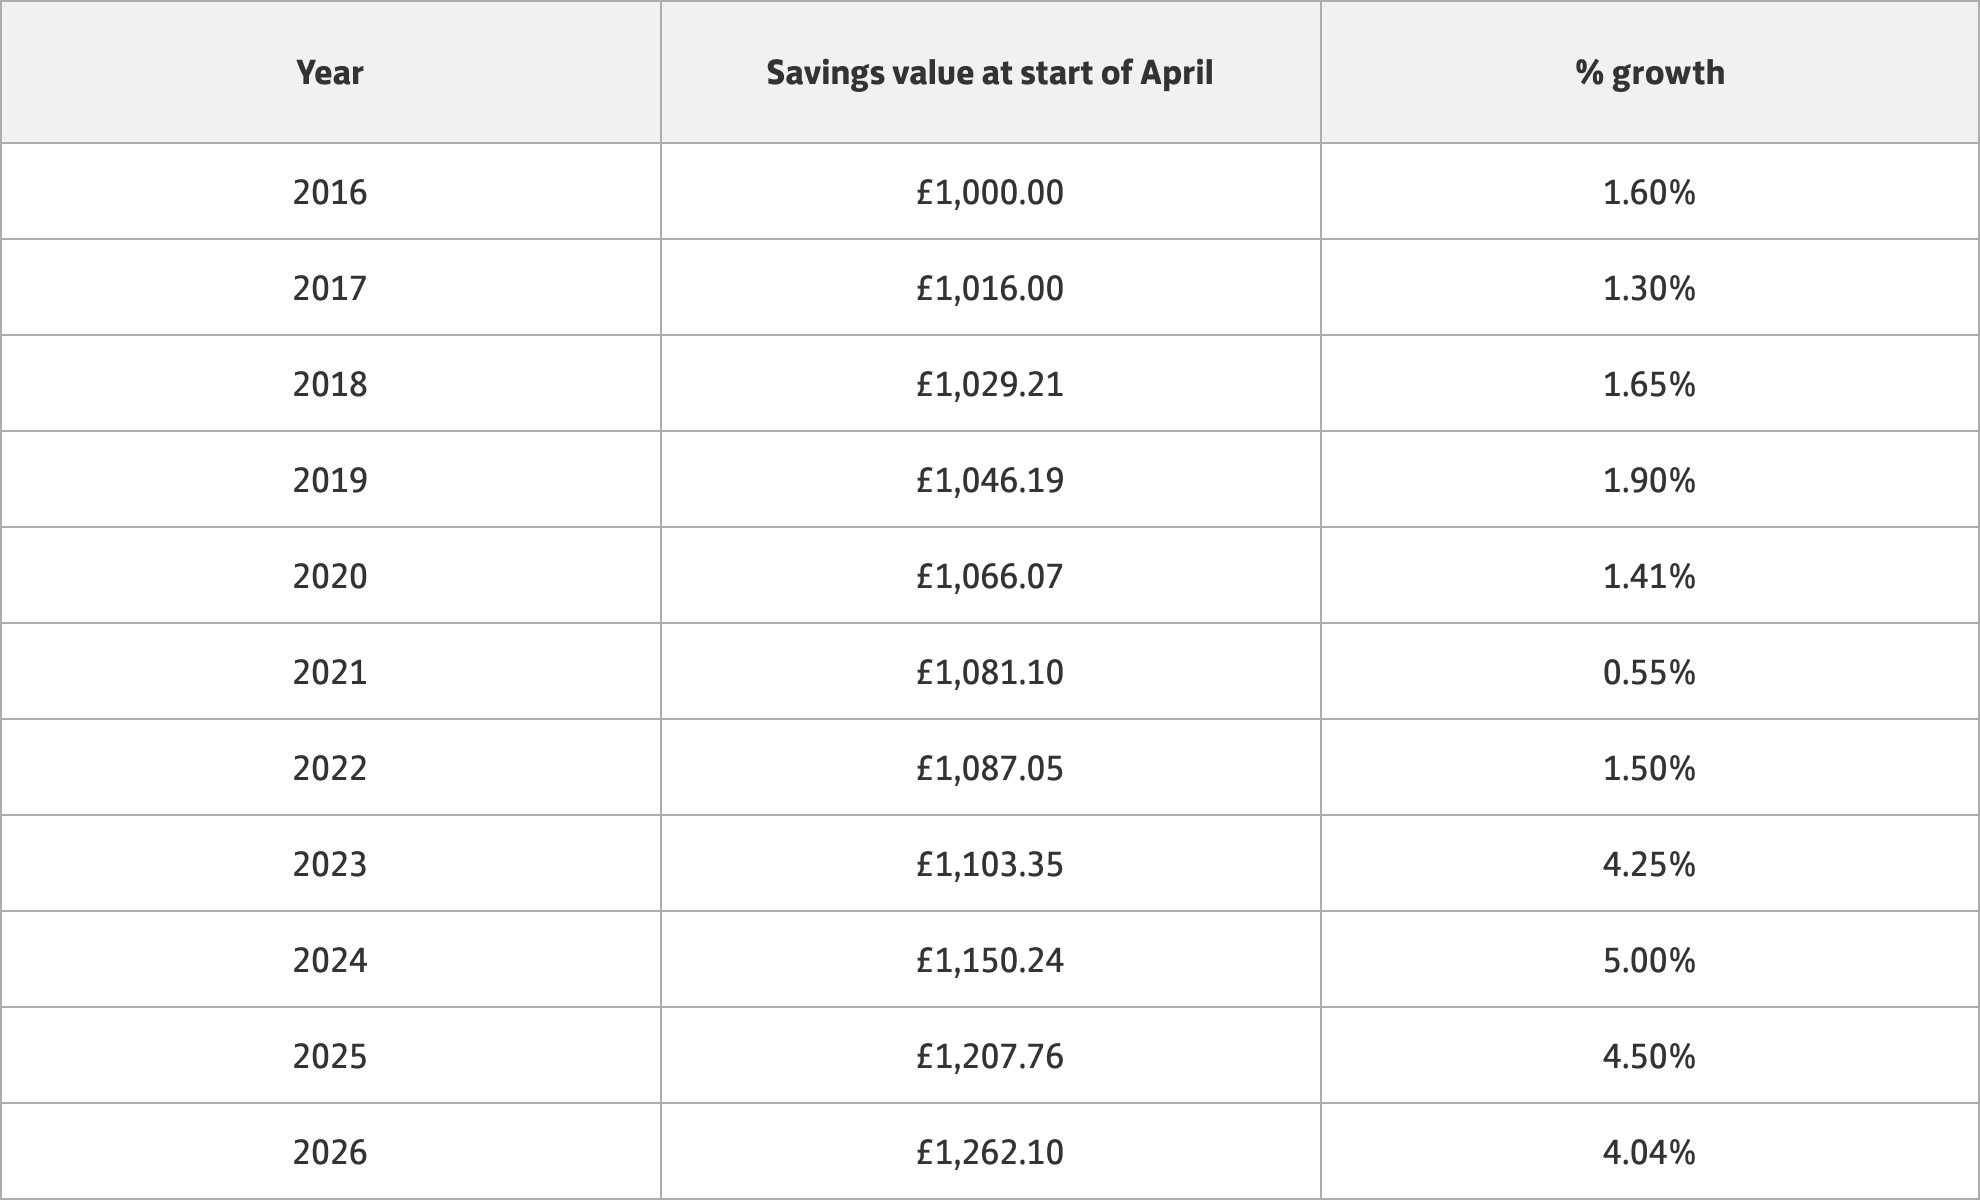
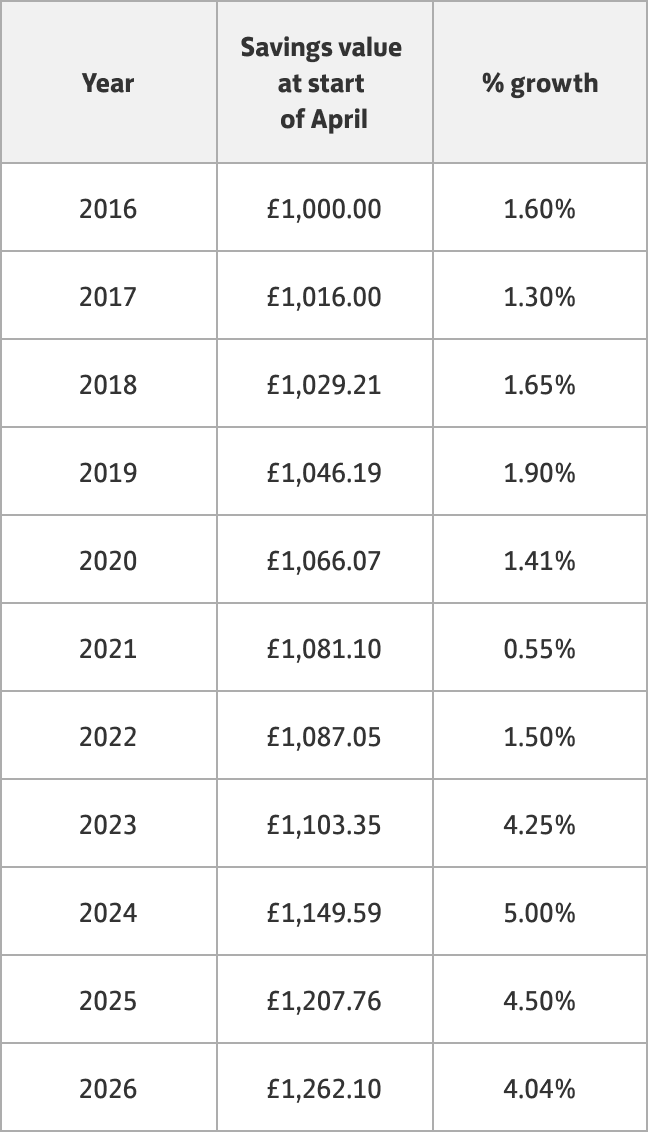
Total balance as of 01/04/2026 is £1,262.10.
AER stands for Annual Equivalent Rate. It shows what the interest rate would be if your interest was paid and compounded once each year.
Gross rate means that we will not deduct tax automatically from your interest. You are responsible for paying any tax due to HM Revenue and Customs. To see more terms and definitions, view our glossary.